OHIO / UNITED STATES
Ohio Power Company (AEP Ohio) / 2025 case study
Power demand grows.
Who carries the cost?
Explore the model ↗Utility service territory is not shown.
Imagery: Esri World Imagery · Esri, Maxar, Earthstar Geographics, and the GIS User Community
01 / The commitment
A smaller load.
A bill that stays.
Infrastructure stays in place when demand falls. The historical tariff assigns part of that unused-capacity cost to the subscribing data center.
Contract demand → actual monthly peak
Annual distribution-floor increment
The utility’s risk, and the customer’s obligation
For Ohio Power Company (AEP Ohio)
Minimum billed demand supports recovery of committed grid costs if the customer uses less capacity. It reduces stranded-cost exposure borne by other customers.
For the data center
Align subscribed demand and energization with a credible ramp. Original terms can include four ramp years plus eight post-ramp years, exit charges and financial assurance. These obligations extend beyond energy procurement.
Historical order: July 9, 2025; original tariff effective July 23, 2025. The annual calculator illustrates 12 months at those historical rates; it is not an actual calendar-2025 bill. The original tariff sets minimum ramp commitments of 50/65/80/90%; agreed commitments may be higher. During ramp, minimum demand is 85% of the agreed ramp capacity; the tiered contract floor applies post-ramp. Actual service voltage and current tariff must be confirmed.
Utility tariff information ↗02 / The hedge
70 MW secured.
The balance stays flexible.
by the assumed block
A partial hedge, not an optimized offer.
03 / Pressure test
When gas rises 30%.
Change from the 2025 baseline annual modeled cost. Fixed and block rates are retrospective benchmarks held constant under stress, not supplier quotes. All three baseline annual totals tie by construction. Tariff charges above are separate.
What moves the bill?
One factor at a time: gas ±30%, capacity ±50%, flexibility energy-only. Separate from the combined slider scenario above. No automatic capacity-tag reduction assumed.
Scenario table & downloads
Published research scenarios below are fixed reference cases; they do not change with the sliders. “Flexible + assumed capacity benefit” and “Gas −30%, capacity −50%, flexible*” assume a prospective 20% capacity-allocation reduction, from 75 to 60 MW. This is hypothetical, not an automatic tariff benefit.
| Scenario | Contract | Annual cost | Change |
|---|
04 / Two markets, one load
Compare the price.
Then question the site.
Same demand. Same physical hours. Different day-ahead hubs. This isolates energy prices; it does not rank construction sites.
Seasonality changes the picture.
PJM MISOMonthly load-weighted day-ahead energy prices, $/MWh. Hubs are not retail meter prices. Non-energy placeholder charges are held equal across markets.
Download monthly results ↓Monte Carlo / uncertainty beyond one year
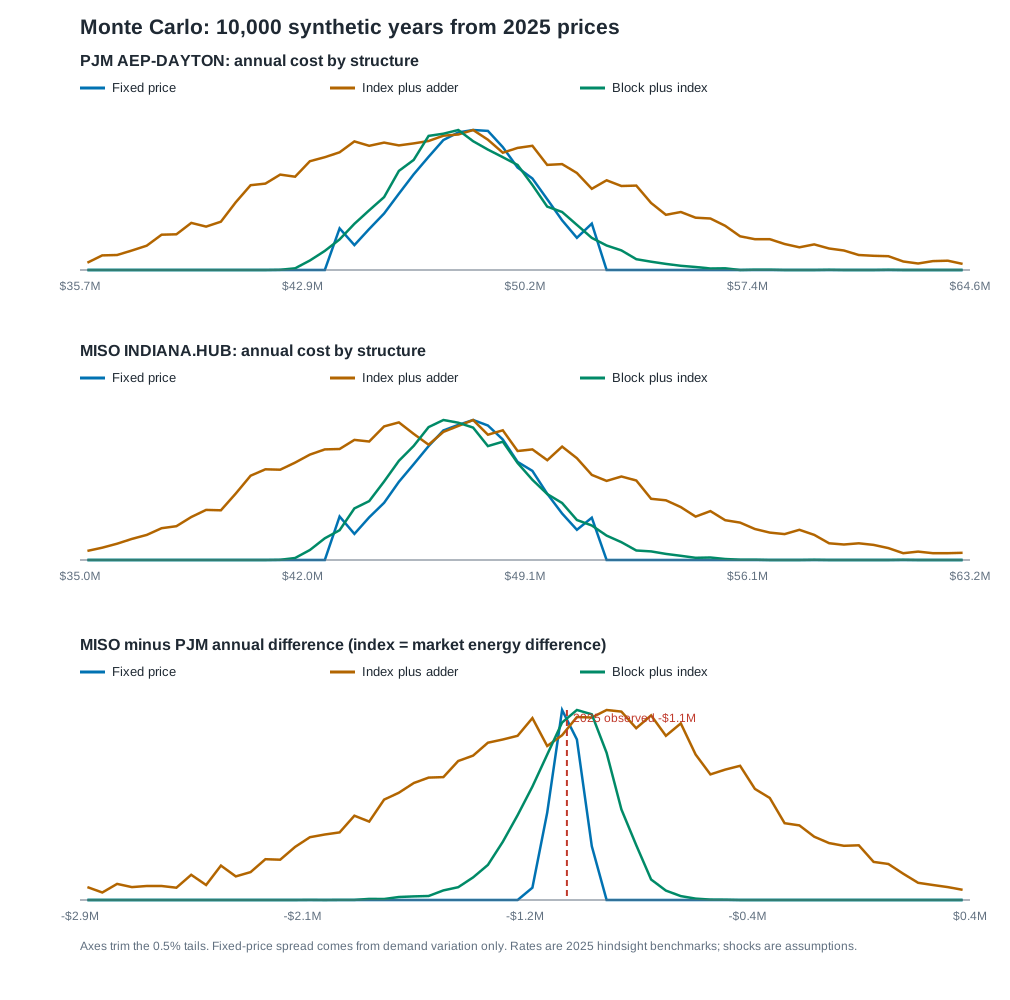
10,000 trials; paired seven-day bootstrap, 15% price sigma and 5% load sigma (variation assumptions). Conditional synthetic outcomes, not calibrated forecast probabilities. Tariff costs remain separate.
05 / Open the model
See the assumptions.
Challenge the outcome.
Historical observations, regulatory rules and illustrative choices are kept visible. Start with the number you want to challenge.
The decision
Confirm the site.
Quote the hedge.
Price the obligations.
Use the 70 MW block as a starting point for supplier quotes. Validate service territory, voltage, connection costs and the tariff before committing. Flexibility savings must exceed operational costs.
Read the model’s full recommendation ↓The recommendation, in practice
Next step: phased site and supplier due diligence, before committing to construction.
Compare delivered cost
MISO’s modeled energy cost was $1.09M lower. Confirm energization dates, connection costs, site prices, tariffs and reliability before choosing a site.
Quote the 70 MW hedge
Covers 77.8% of annual use. At +30% gas, PJM’s cost increase falls from $3.75M to $0.83M. Also request a fixed-price quote for budget certainty. Historical baseline totals tie; actual offers may differ.
Budget for capacity exposure
A +50% modeled capacity-price stress adds $2.74M/year, even with fixed energy pricing.
Price the minimum-demand obligation
The historical 100 MW contract / 50 MW actual-peak case adds $2.64M/year above billing at actual demand: 85 MW billed for 11 months, then 82.5 MW, assuming a prior 100 MW peak and no new peak. During ramp, use 85% of agreed ramp capacity.
Test flexibility’s net value
A 20% cut in 10 system-peak hours shows gross modeled savings of $48,112 in PJM or $46,046 in MISO under index pricing, before operational costs. Peaks were selected retrospectively. No guaranteed capacity or monthly-floor reduction.
Set the construction approval gate
Confirm service voltage, approved ramp and term, riders, taxes, exit fees, collateral, liquidity and infrastructure responsibilities. Obtain dated quotes and test low-load cash flow. Treat collateral funding separately from annual operating costs.
Historical 2025 model; gross savings and stress outcomes are illustrative. The distribution-floor example applies only to Ohio Power Company (AEP Ohio), excludes riders and taxes, and illustrates 12 months at historical rates.